


12 strategies to uncover any wrongs inside
The use of various models to inform decision-making has never been more popular. With the rise of big data, cloud computing, and industries like analytics-as-a-service (or, better yet, actuarial-as-a-service), professionals are putting more and more trust in models all across the business life cycle. Which means these days there is an ever-growing risk of deploying an incorrect model in production, leading to sub-optimal or even wrong decisions.
As a result, having a “right” model is critical for good decision-making. Whether it’s pricing a new line of business, cash flow testing your reserves, or performing experience analysis, your model needs to be at the very least not wrong in order to be useful.
This expansion of the use of actuarial models has, naturally, attracted a lot of attention from the consumers of the actuarial model outputs: Chief Actuaries, Chief Financial Officers, Chief Risk Officers, marketing and product development departments, and even regulators. Using a bad model can sink a product line or even an industry. So everyone wants a “good” model.
But how do you get there? How do you ensure that your model is right?
Well, unfortunately, nobody can guarantee a model is 100% correct. That’s why it’s a model, after all. It is a representation of what could happen in the future. And so we must always remember this simplification is intended to be useful more than it is intended to be precise.
That said, we have a lot of experience building, testing, and using actuarial models. As a result we’ve gleaned some strategies that, if applied, could help you make your model more useful by making it less wrong with each iteration.
If you’re looking to apply this to your modeling practice, periodically perform these investigations of each of your models. If you get an answer that you don’t like, that’s where you need to focus your remediation efforts.
Level 1 – Practical Mathematics
First off, you can’t get anywhere if the numbers don’t add up. These strategies are the fundamentals of making sure all the math is done correctly. If you find an error here, better check your plus and minus signs!
Ensure that the Income Statement and Balance Sheet tie together
It feels like this is just going to be right everywhere, but you’d be surprised how often a component gets missed. Especially when adding new features or modifying something that’s been around for a while. The principle is pretty simple: when your reserves go from 100 to 50 on the balance sheet, there should be a corresponding Change In Reserves of -50 on the income statement. Etcetera for all your other assets, liabilities, and cash flows.

Confirm that values evolve over the time periods in a reasonable manner
That is, do you see the numbers changing in a reasonable way over time? For example, look at the count of deaths from one period to the next. Does it make sense? Does the rate of deaths from one time period to the next make sense? If there are large jumps, are they explainable by standard industry conclusions? (Like term life mortality jumping after the guarantee period, and lapses doing the same, as better risks go elsewhere for more coverage and the poor risks stick around.)
Look for inflection points
Inflection points are places where the change in something shifts from positive to negative, or vice versa. For example, suppose you’re looking at Distributable Earnings. For the first 10 years, these are all positive, and for the first 5 years, they’re increasing year over year. Years 6 through 10, however, they’re still being positive, but now shrinking. There has been an inflection at year 6 from positive growth to negative. This should be a clue that something is changing in the model. Are you running into or out of a guarantee? Did you adequately account for surrender charges? There are too many different options to list them all. But when you see rates that have been increasing start to decrease, or vice versa, those are suggestions that there are underlying components within your model that are changing. It’s up to you to confirm whether those changes are appropriate.
Does everything eventually go to zero or reach a steady state?
It should. If you’re looking at an in-force block, with no new policies, eventually everything’s going to head towards zero through attrition (deaths and lapses). If you’re looking at new business models, do you eventually get to a point where the new business strain is offset by later-period positives from later-duration policies? If not, you might want to check your assumptions, code, and model mechanics. You could find an error of application that was obscured by other model features.
We have first-hand knowledge of a model which foretold the “zombie apocalypse”. A few decades into the projection, the model predicted people started rising from the dead. Well, they weren’t really, but there was a mortality improvement assumption (-1.5% per year) that, it turned out, was set to additive rather than multiplicative. Over time those -0.015s added up and 0 mortality suddenly became negative (–0.015), which meant that instead of 0 policyholders in-force, the model was showing more people alive than had been the year before.
Negative deaths.
Oh, sure, this may be an extreme example, but we’d rather not wait around to find out if it’s true. Let’s just set that mortality improvement back to multiplicative and force the zombies to stay dead after all, shall we?
Do you start at the right order of magnitude?
Beware of “immaterial” little parts. Small components can be off by a factor of 10 or have the wrong sign, and this difference compounds throughout the projection leading to nonsense results. This is especially true when you’re creating subset models, which might have portions of aggregate value allocated to product lines or portfolios. For instance, suppose you have 500 units of X dedicated to the 500 units of Y. If you subsequently choose to look at Y in 2 subgroups Y1 and Y2, you have to remember to also allocate X in some manner. Otherwise you’d have 500 to Y1 and 500 to Y2, which is like double-counting a part of your model. Don’t do that.
Oh, sure, you might like the results now, but when the Actual-to-Expected calculation comes out, somebody’s gonna have a very uncomfortable quarterly goals review meeting.
Level 2 – Getting to know your model intimately
In other words, how to put your model through its paces to find out what it’s really made of.
Distill it
That is, break the model down and see if you can explain the important parts in a succinct and clear manner. Give it the Executive Summary treatment: you get one page to describe the purpose, the audience, the time frames, the sources of data, critical outputs, and important drivers of results.
If you can’t get all of that in one page, it’s likely because you’ve got a lot of hand-waving, caveats, and exceptions. If so, then there could be one or more problems: you don’t know the model well enough, but others do, so you need to engage in some serious knowledge transfer. Or there’s not enough documentation, which means the intern has a new to-do list. Or it’s an old, stale model that nobody should be using anyway and it’s time to revisit the assumptions, the mechanics, and the purpose (audience and the decisions that are being made from it).
Compare to the Model Optimization Hierarchy
This is a way of thinking about how trustworthy your model is. It’s a self-reinforcing feedback loop: as you improve the trust of your model (move upward in the hierarchy), you’re more likely to have a right model. As the model is more likely to be right, it’s likely to move upward in the hierarchy. Where you are will tell you a lot about whether the model is right for the purpose, or if it still needs some work.
Look for nonlinearities
Not all 10% increases are created equal. And by that we mean, assumption effects are often more impactful in one direction than in the other. Especially when it comes to truncation models or those which use a CTE measure (conditional tail expectation).
Principles-based reserves, for example, use a CTE70 measure. [Take the average of the (100% – 70% = 30%) of the scenarios.] If your model increases expense 3% across the board, sure, on average, your asset funding need might increase by exactly that amount. However, because your final measurement isn’t the average across all the scenarios, but only the worst ones, it’s likely that your reserve amounts are going to increase by significantly more than the average. You might need to run a few different tests, at various magnitudes of change, to determine how your various outputs change as a function of the volatility of your inputs.
Get graphic
Seriously. Graph your results. You might be surprised what you find.
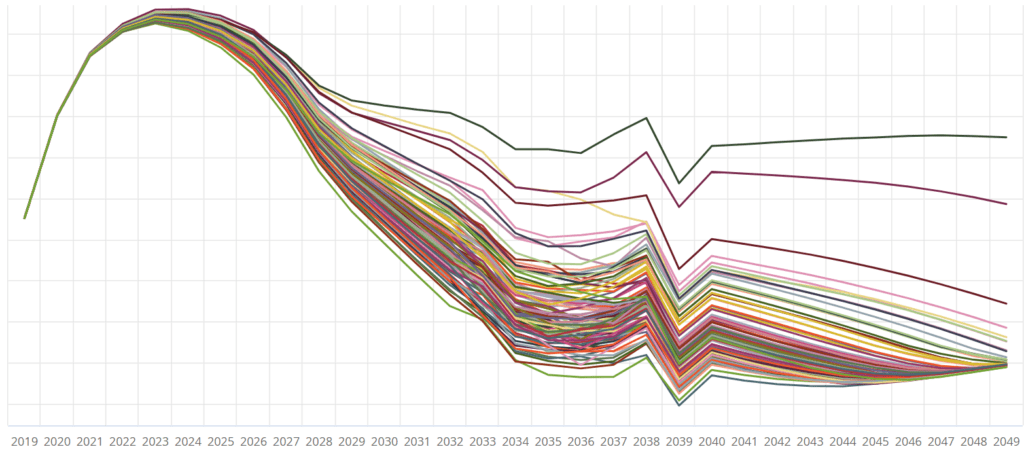
There’s lots of stuff that looks good when it’s just numbers. But when you graph it you often get a different picture, which can point you to errors or just elements you need to be sure you really want in your model.
Try to break it
Sometimes you don’t know what’s wrong until there’s something actually wrong. In this test, you’ll intentionally put in bad data. Do you get bad results out? Do you get errors? Or, are you going to find something underneath that is compensating without being explicit about it? If it is, you’d better find out what’s going on. There’s a good chance that this model is also “correcting” your good data in ways that you didn’t expect.
Level 3 – Advanced maneuvers
So you’ve discovered all the mathematical errors and you know what you’re using the model for and why. Now – can you still find things to improve? Can you make your model even righter? Of course you can.
Have an assumption margin throwdown
This is where you really find out whether your model is aggressive, “best-estimate”, or conservative. List all of the assumptions within your model. (Note – numbers that are pre-defined, like Treasury rates at a point in time, are not assumptions. Those are just inputs. How Treasury rates evolve in the future, that is an assumption.)
Put all the “conservative” ones in one column, all the “aggressive” ones in another. Line them up like they’re ready for battle. Figure out whether your model is heavily weighted in one direction or the other. One side may win. If it does, you’ll know which way the model, as a whole, is leaning. Or maybe you’ll find out that it’s pretty well balanced, in that some aggressive assumptions are offsetting other conservative ones.
The big test will be comparing this to the conventional wisdom about the model. Perhaps everyone thinks it’s a conservative model, but when you line it up, you see that 3/4 of the assumptions are aggressive, and half of the rest are best-estimate while only (wait, I can do this…) 1/8 are actually conservative. If you don’t like what this is telling you (that your model is too aggressive to be trusted, and you’ll often fall short of its goals, or that it’s too conservative, (thus you’re leaving margin on the table), then you’ll know it’s time for some assumption changes.
And don’t forget to compare not just to what people think about the model, but what the actual purpose is. Sometimes it’s okay to be conservative – if that’s what you wanted. Or the other way around. If you’ve given it the single-page treatment (step 6 above), then you should have everything to you need to make the appropriate evaluation.
Know the major levers and their sensitivities
Not all assumptions are created equal. Some components are major drivers of volatility in results. Others are not. Expenses, for example, could influence pricing results much more heavily than in cash flow testing. So it’s essential to know which of your drivers are important for your model. Which assumptions or model features make the most impact in your target outcomes? Watch those closely. Which ones don’t make much difference at all? Perhaps give them a wider tolerance for deviation before you start sounding the alarm.
Asset modelers already do this with “Key Rate Durations” of the asset portfolio. They can attribute the overall change in value to individual components of the interest rate curve: the 90-day rate, the 1-year rate, the 5-year rate, etcetera. It would be pretty cool if you also knew the Key Age Durations for your mortality (i.e when 50-year-olds have a 10% spike mortality event it impacts only 20% as much as 60-year-olds with the same increase), and Key Rider Durations for your variable annuity block (when GMWB election increased by 10%, ROI increases by 2 bp)? You can, if you measure the changes at some of those granular levels as well as the aggregate and look for the places where the sensitivities don’t offset.
This is an advanced practice of #8 above. As such, it’s probably best reserved for later in your model development efforts – when you’re really looking to find those any last little bits of refinement to make your model as not wrong as possible.
Conclusion
Remember, when you’re doing all of this model evaluation, the most important thing to keep in mind is the purpose of the model. If you lose sight of why you’re doing this, as in, the business decisions your audience is going to take as a result, you can get locked into a forever spiral of making your model marginally more precise for no material improvement in usefulness.
Don’t let that happen to you. Keep your models up-to-date and useful, and you’ll always have a clean conscience.