

“All models are wrong, but some are useful.”
—George E. P. Box
This quote is very familiar to modelers, not just in the actuarial world but in statistics, biology, economics, and even politics. The essence of the quote comes from the need to simplify the “real world” in order to understand it, even at a very high level, and then make use of that simplification for future action.
HOW DO YOU KNOW IF YOU NEED A MODEL?
These are, therefore, the two minimum criteria for creating a model: simplification of a complex theory, and the use of that simplification to make predictions about the world to come.

Because if it wasn’t simplification, if you had the exact relationship, you wouldn’t need a model. Converting between Fahrenheit and Celsius doesn’t require a model. Likewise determining the distance between, say, two cities, or the Earth and the Moon. All of these are known and defined already. These require no simplification, they just exist.
The second reason for a model is to predict future experience. Because if wasn’t being used for predictions, what are you using it for, exactly? In this same example, the distance between the Earth and the Moon varies slightly over time. To get an idea of where these two bodies will be in 5,000,000 years, however, requires a model to predict, based on the current state, recent past, gravitational theory, and perhaps some additional randomization factors about the future (sunspots, meteors, etc.).
WHAT ARE THE COMPONENTS OF A MODEL?
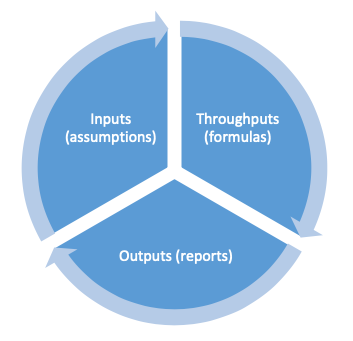
There are 3 essential parts to a model. (Note – even this simplification could be considered a model – a model of models, if you will.) Those three parts are the Inputs, Throughputs, and Outputs.
Inputs are generic facts. They might be the historical daily high temperature at a specific weather station. Or they might be the 20-year weekly average of a stock market index. Basically, these are a set of numbers that are verifiable, don’t require judgment, and don’t really do anything for your model. They just are.
The second part of the model is the throughputs. These are the formulas that make the transformations between inputs and outputs, and what generally comes to mind when you hear “model”. But, to conclude that this is the whole of the model is actually an oversimplification. Yes, this is where the “guts” of the model reside, and you can get quite technical in this section, but it’s only one critical component. The throughputs don’t exist without the inputs or outputs. In a sense, they’re dependent on one another. Symbiotic, if you will.
The outputs are the final products, what decisions are based on. These outputs come in many forms – sometimes graphs, or tables, or visualizations. But the outputs are more than just numbers.
Outputs are not just the reports and results, but the interpretations of those results. You might be running a cash flow test of a life insurance product, and the model “output” indicates that across 95% of your stochastic scenarios, surplus at 20 years out is positive. What does that mean? And how is it dependent on the other elements of your model?
Frankly, none of the parts are independent. Because what answer you’re searching for (your outputs) will determine your model functions (throughputs) and your assumptions underlying (inputs). Correspondingly, what information you have available (exact historical values or assumptions) and what functionality you can program also affect the decisions you can make with the outputs of the model. And so on.
A NOT-SO-SIMPLE EXAMPLE
Let’s take a look at a model for a life insurance company and identify all of the parts.
First, a question for simplification:
Will our portfolio of invested assets provide enough cash flow to pay all our term life insurance claims and expenses over the next 20 years?
Why this needs a simplification: Because there are so many moving parts, from policyholder behaviors (lapses, conversions, changes to dividend option selections, and more) to invested assets (asset classes, investment time frames, prepayment schedules, reinvestment rates, etc.) that no one spreadsheet, or piece of software, could possibly capture every single feature of every single policy and every single invested asset. To attempt to do so would be foolish and a waste of time, due to the tradeoffs between precision, accuracy, and expedience. [More on that later, too!]
Why it is a useful prediction: Because nobody really knows what will happen over the next 20 years. Economies change; businesses, governments, and individuals sometimes make irrational decisions; and future paths may not follow exactly as you planned, leading to unexpected new options, etc. However, it may still be useful because, should the model predict undesirable consequences in certain future scenarios, the insurance company could make decisions today that would mitigate those undesirable consequences.
Now, what are the 3 components of the model for this example?
Inputs: All the relevant facts about the policy, the current status, and so forth. For life insurance, you might input the policy term (10 years, 20 years, etc.), the face amount, the expected mortality rate, expected lapse rates, perhaps a current 10-year Treasury yield curve, expenses, taxes, etc. Most of these are assumptions, but not all. (Historical values of Treasury rates are not assumptions. How those rates may change in the future are assumptions.)
Throughputs: All of the formulas of the model as calculations advance through time. Is mortality select, ultimate, or select and ultimate? What is the ratio of commissions to premium (generally a linear relationship, but not necessarily)? Is commission considered before policy fees, or after? Is reinsurance going to be applied as coinsurance or catastrophic?
Outputs: Reporting that helps the user actually make decisions. For a life insurance product, outputs might include: number of policyholders alive at a point in time; average investment income rate over the period; or the excess (or deficiency) of the assets measured against the liabilities at any point in time. Generally, these are presented in pre-packaged reports, which often show changes in target values over time. The outputs are not independent of the model, nor are they independent of the inputs.
And, to be clear, just because a model output is a specific number, or a specific rate, or a certain trend, does not, in itself, become anything like actionable insight. As we’re answering the question above, Will the invested assets be sufficient?, the model output might be, “There are sufficient assets to pay all claims through year 18, 80% of claims in year 19, and only 60% of claims in year 20.” But the interpretation of that output, which is the essence of the actuary’s value added to the process, is also critical. Is 80% sufficient? Is 60% sufficient? How might the company change in the intermediate years to be able to pay 100% of claims in year 20?
Is 20 years even the right horizon, if in year 21 the company can only pay 80% of forecasted claims again? What were the results when the company did the same test last year? What changed in the meantime? How might those changes affect the interpretation of the results?
All of these questions require judgment, and the appropriate understanding of all the various aspects of the model, whether inputs, throughputs, or outputs.
CONCLUSION
The ability to interpret results is part of effective use of any model and should be considered an essential skill for modeling actuaries.
So many questions require much more than simple facts and figures, and that’s where appropriate modeling techniques, and software, become essential. Slope Actuarial Software has the capacity for building and scaling models that can supply the actuary with the right answers to difficult questions.
Helping actuaries to become not just “more right”, but “more useful” too.