

Results Analysis
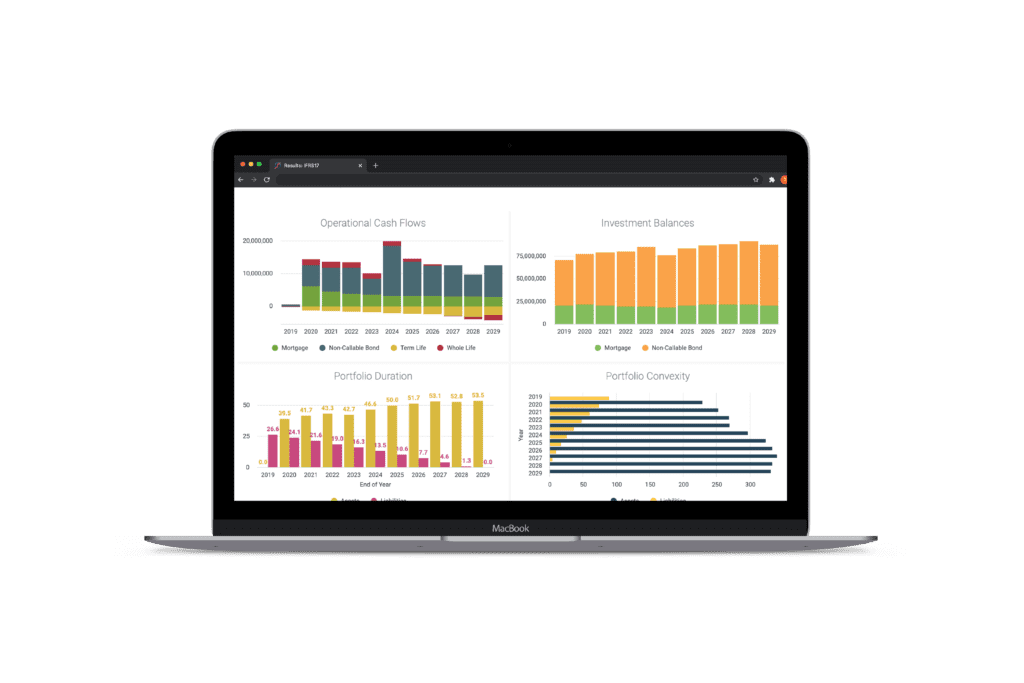
Powerful visualizations
SLOPE’s embedded analytics engine automatically populates report dashboards with key data from your model runs. Assess results, trace through values, adjust your model – all in the same platform.
Embedded Solution
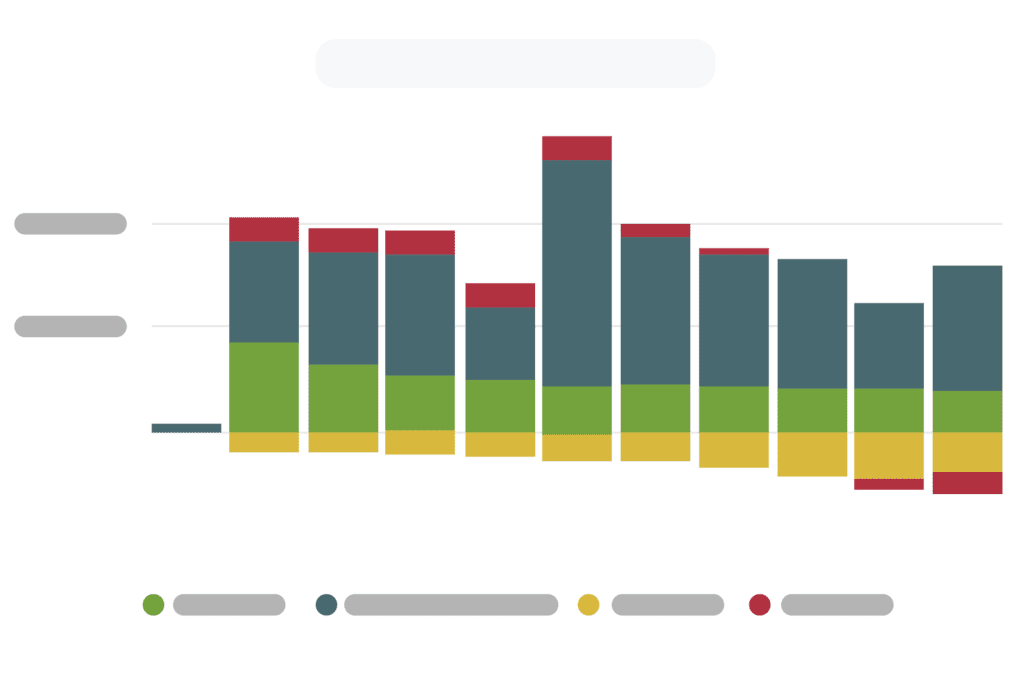
Visual analytics, zero effort
No post-processing or data migration is required after execution. Start analyzing your results in SLOPE’s embedded analysis module as soon as your model run has completed.
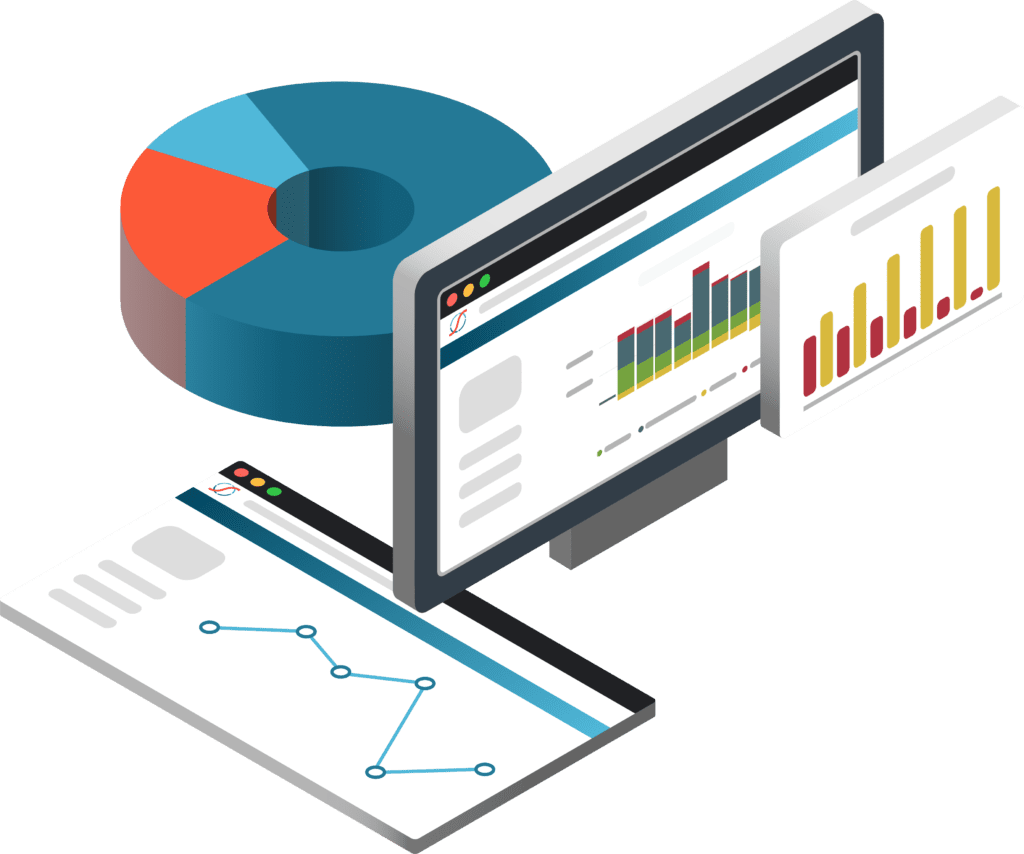
Pre-Built Report Suite
Functionality, out of the box
Take advantage of standard reports that address common business needs. Easily build your own reports to uncover unique insights in your data.
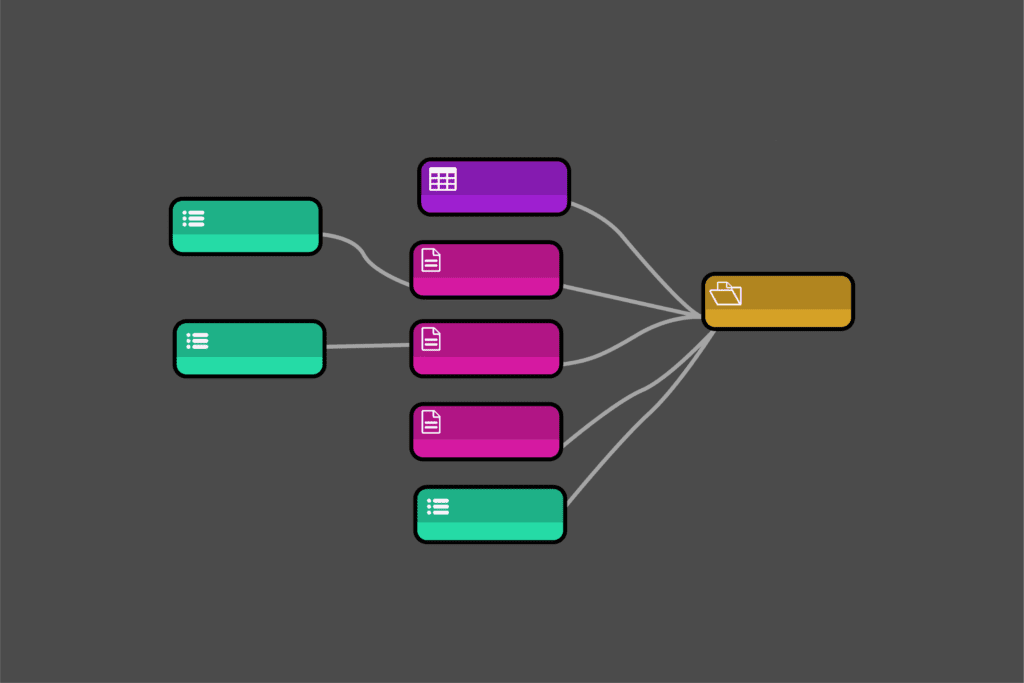
Drill-Down Capability
Discover the drivers of your results
Dig into your data at a granular level after a run with the ability to trace calculations through individual model points and timesteps.
Benefits of visualizations
Ready to see more?
Join us for a free demo and experience the full range of SLOPE’s capabilities.